CloudWatch
Recently I covered basics of CloudTrail, service that gathers logs from API calls to AWS, either done directly or indirectly via Management Console, CLI, etc. Now time has come to take a closer look at CloudWatch, monitoring system for AWS services and your application.
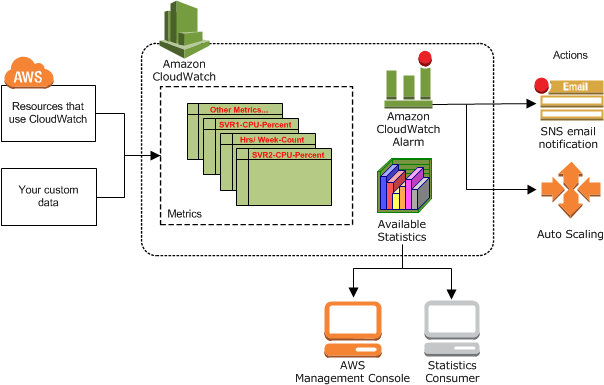
CloudWatch features:
- Metrics collection
- Dashboards – customized graphical views from metrics
- Alarms
- Events
- Storing logs
Metrics
Metrics are portion of data with a timestamp and unit received from AWS service or custom application. An example is CPU usage in specific time from some EC2 instance. Metrics are uniquely defined by:
- Name
- Namespace – kind of container for metrics that isolates metrics from each other, so that metrics from different applications are not mistakenly aggregated into the same statistics.
- Dimensions – name/value pair that helps categorize metrics. Because dimensions are part of the unique identifier for a metric, whenever you add a unique name/value pair to one of your metrics, you are creating a new variation of that metric. For example, you can get statistics for a specific EC2 instance by specifying the InstanceId dimension when you search for metrics. CloudWatch treats each unique combination of dimensions as a separate metric, even if the metrics have the same metric name.
To extend number of metrics you can use CloudWatch agent that can garter in-guest EC2 metrics or metrics from your on-prem servers. If you need to monitor your application you can also create custom metric that will gater data from application.
Metrics collection
CloudWatch retains metric data as follows:
- Data points with a period of less than 60 seconds are available for 3 hours. These data points are high-resolution custom metrics.
- Data points with a period of 1 minute are available for 15 days
- Data points with a period of 5 minutes are available for 63 days
- Data points with a period of 1 hour are available for 455 days (15 months)
Data points that are initially published with a shorter period are aggregated together for long-term storage. For example, if you collect data using a period of 1 minute, the data remains available for 15 days with 1-minute resolution. After 15 days this data is still available, but is aggregated and is retrievable only with a resolution of 5 minutes. After 63 days, the data is further aggregated and is available with a resolution of 1 hour.
Alarms
Alarms are used to automatically initiate actions based on metrics. An alarm watches a single metric over a specified time period, and performs one or more specified actions, based on the condition if threshold was reached. The action can be a notification sent to an Amazon SNS topic, an Auto Scaling policy or EC2 action, like stop, recover, terminate or reboot.
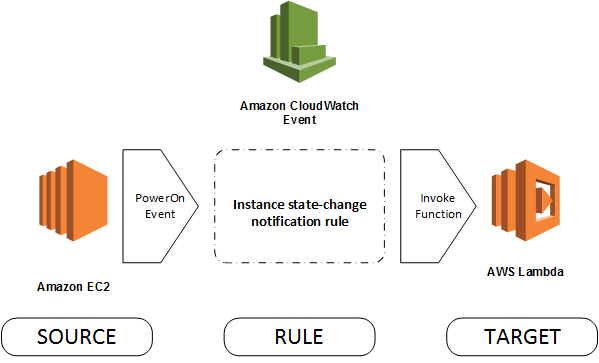
Events
Events are tasks that are performed on AWS resources or they can be generated via API. Based on them you can set target – what action should be performed. Rules select events for processing by targets. For example an event is triggered when EC2 is started, a target can be a lambda function, as in example below:
CloudWatch Logs
CloudWatch Logs can store log files from EC2 instances, Route 53, and other sources. You can then retrieve the associated log data from CloudWatch Logs. For example CloudTrail logs can be sent to CloudWatch Logs, where metrics can be filtered and based on that we can create CloudWatch alarms.
Reference Materials
AWS on the road
Understanding CloudWatch Events
AWS CloudWatch documentation

Like!! I blog frequently and I really thank you for your content. The article has truly peaked my interest.